
Now Reading: Weekly data: Oil and Gold: Price review for the week ahead
-
01
Weekly data: Oil and Gold: Price review for the week ahead


Weekly data: Oil and Gold: Price review for the week ahead

This preview of weekly data examines USOIL and XAUUSD, with economic data expected later this week as the primary market drivers of the near-term outlook.
Highlights of the week: British inflation, FOMC minutes, UK manufacturing & Services PMI
Wednesday
- British Inflation rate at 06:00 AM GMT where the figure for July is expected to increase from 2.6% to 2.9%. If it’s confirmed then the pound might witness some short term gains against other currencies.
- FOMC Minutes at 18:00 GMT where investors and traders will be paying close attention to any hints from the Federal Reserve in terms of future developments on the monetary policy. Currently, the possibilities of a rate hike have been pushed back to December’s meeting according to the Fedwatch tool whereas any dovish narratives might push the prospectus of a rate hike further back.
Thursday
- Japanese inflation rate at 23:30 GMT. The expectations for July are to remain stable at the current level of 1.7%. If this is confirmed it would be the second month in a row with stable inflation however any significant diversion from this value could create further volatility for the yen pairs.
Friday
- Flash British manufacturing PMI at 08:30 AM GMT. The expectations for the figure are at 51.5 compared to the previous 51.9. UK manufacturing has managed to remain above the 50 point mark since November 2025, and if the expectations are confirmed then it might create some short term gains for the pound.
- Flash British services PMI at 08:30 AM GMT. Market participants are expecting the publication to be at 51.8 points compared to the 52.1 points of July. The services sector in the UK is generally above the 50 basis points and this shows the health and strength of the service sector in the UK and could potentially create some support for the quid in the immediate aftermath of the release.
USOIL, daily
Oil prices rose for a third straight session as hopes for a deal to end the Middle East conflict weakened. Iran signaled it could adopt a more offensive military stance, while the US ruled out extending the temporary ceasefire, increasing concerns over potential disruptions to energy supplies. Progress on reopening the Strait of Hormuz has stalled, with tanker traffic remaining limited. A vessel was struck by a projectile while leaving the strait, while Houthi militants also reported attacks on vessels in the Red Sea. Meanwhile, Iran’s separate talks with Oman over managing Hormuz remain unresolved, adding to uncertainty over regional oil flows. Traders are also watching US oil inventory data this week, after a surprise rise in stockpiles last week.
From a technical perspective, crude oil remains in a short-term bullish phase, with price trading above both the 50-day and 100-day SMAs, although the 100-day SMA is still relatively close and could act as resistance. Price is currently testing the 23.6% Fibonacci retracement near $85, making this the key level for the next move. The Stochastic oscillator is deeply overbought, suggesting the rally is becoming stretched and increasing the risk of a short-term pullback. The Bollinger Bands have widened slightly, reflecting elevated volatility, which could support any sharp moves in the upcoming sessions. A decisive break above $85 could strengthen the bullish outlook and open the way toward the $90–92 area, while a rejection could send prices back toward the $82 and $80 Fibonacci support levels.
Gold-dollar, daily
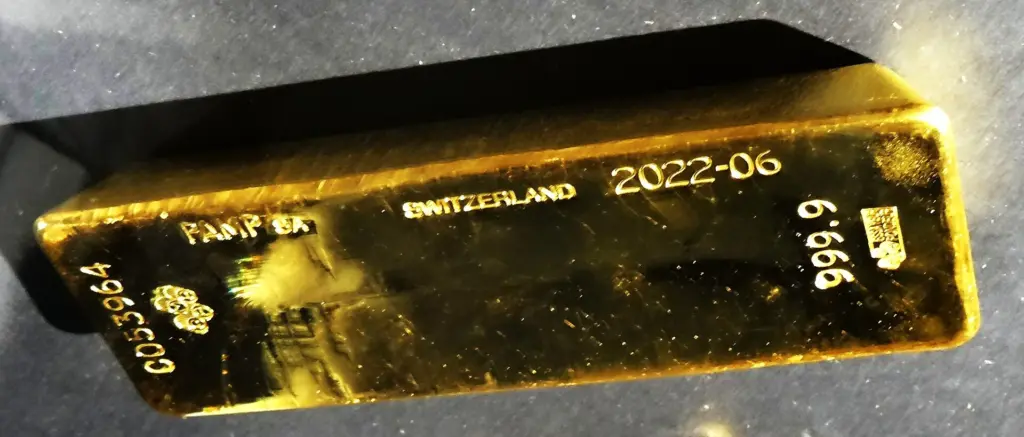
Gold steadied near $4,400 an ounce, supported by a weaker US dollar and reduced expectations for further Federal Reserve rate hikes. Recent softer US economic data has lowered the probability of additional tightening, easing two major headwinds for the yellow metal. Gold is also benefiting from concerns over rising US government debt, renewed investor demand and stronger central-bank buying, particularly from China. Meanwhile, continued tensions in the Middle East and disruptions around the Strait of Hormuz are providing additional safe-haven support. Investors are now awaiting the Fed’s July meeting minutes and upcoming remarks from Fed Chair Kevin Warsh for further clues on the outlook for interest rates.
From a technical point of view, gold has strengthened significantly, breaking above the $4,200 resistance and reclaiming both the 50-day and 100-day SMAs, signalling a clear improvement in the short-term trend. Price is now around $4,400, approaching the upper Bollinger Band, while the Stochastic oscillator is deeply overbought, suggesting the rally may be stretched and vulnerable to a short-term pullback. The next major resistance is around $4,500, while the 100-day SMA near $4,315 now acts as an important support level. Overall, the technical outlook has turned bullish, although overbought conditions increase the risk of consolidation or a correction before the next leg higher.
Disclaimer: The opinions in this article are personal to the writer and do not reflect those of Exness.